Sports
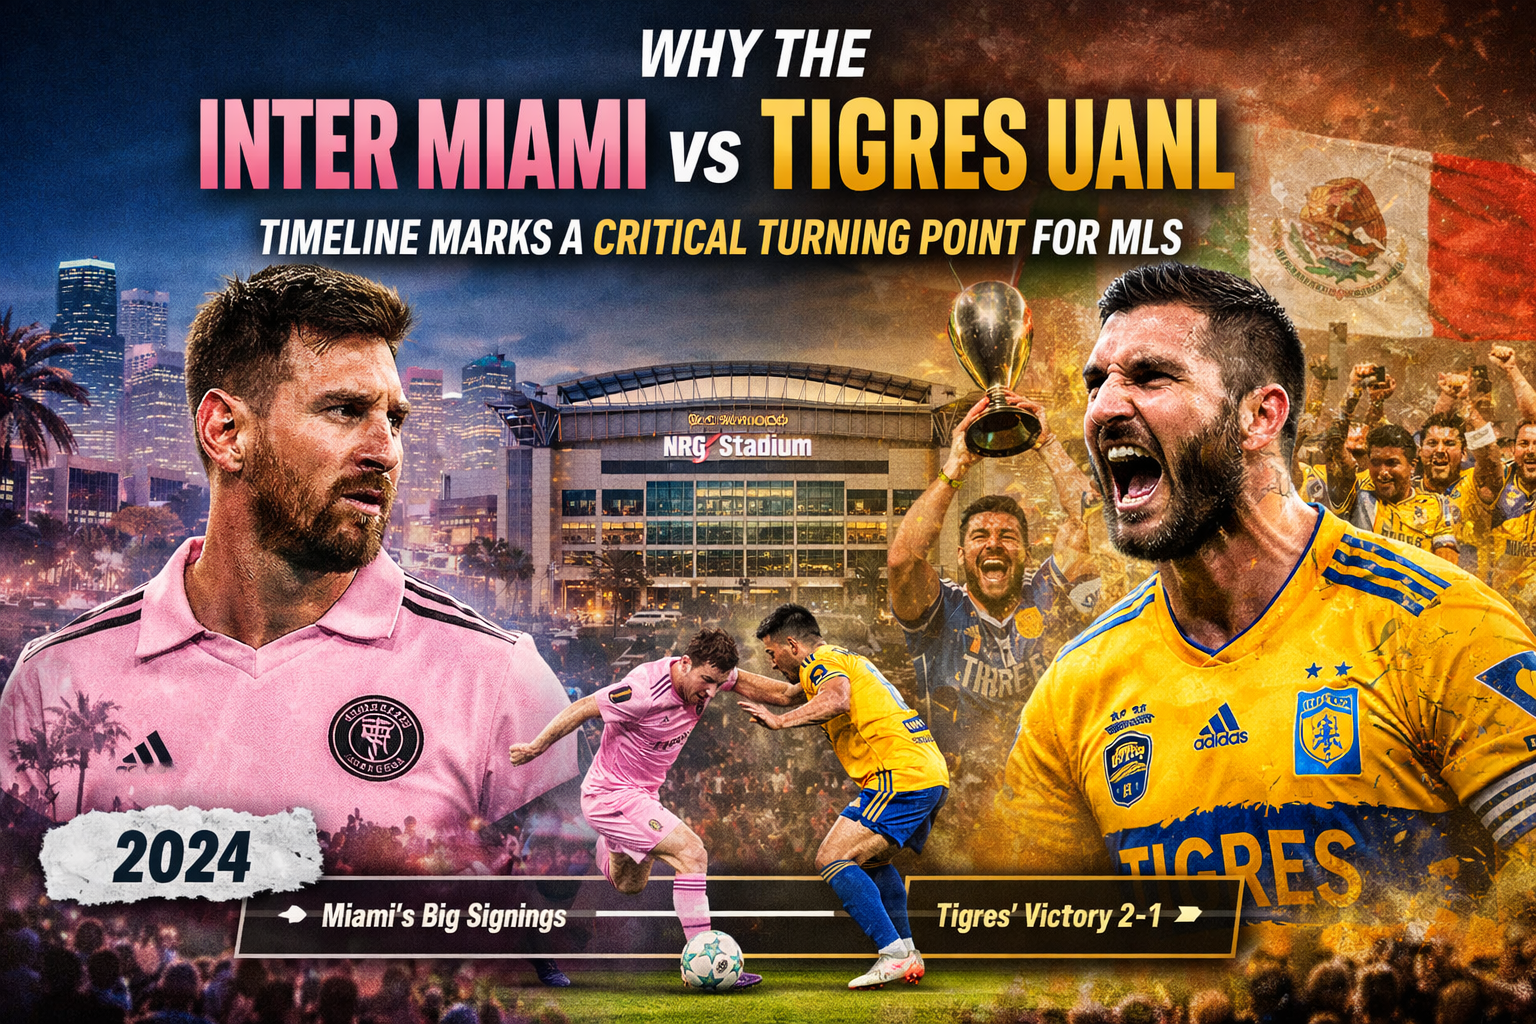
Why the Inter Miami vs Tigres UANL Timeline Marks a Critical Turning Point for MLS
You can throw money at a roster. You can buy the greatest player to ever lace up a pair of boots. But you cannot buy grit.
That is the lesson.
When we look back at the timeline of Inter Miami versus Tigres UANL, we aren’t just looking at a schedule of soccer games. We are staring at a collision of philosophies. On one side, the glitter of South Beach and the frantic, high-stakes project of Jorge Mas and David Beckham. On the other? The entrenched, ferocious solidity of Liga MX’s northern giant.
It’s a story of prestige. It’s a story of humbling moments. And frankly, it’s the exact wake-up call Major League Soccer needed.
What is the Inter Miami vs Tigres Timeline?
The Inter Miami vs Tigres timeline is a chronological record of competitive matchups, primarily within the Leagues Cup, serving as a barometer for the sporting gap between arguably the most ambitious MLS franchise and the most consistent Liga MX powerhouse of the last decade.
This isn’t a long history. It’s a violent, condensed one.
The Collision Course: How We Got Here
To understand the timeline, you have to ignore the calendar for a second. Look at the context.
For years, MLS teams were the little brothers. Liga MX clubs would come north, play at half-speed, and still walk away with a win. Then, Miami changed the math. Or tried to.
Bringing in Lionel Messi, Sergio Busquets, Jordi Alba, and eventually Luis Suárez was supposed to be the cheat code. The assumption? That talent of that magnitude simply bulldozes everything in its path.
Then they met Tigres.
Tigres UANL isn’t a normal team. They essentially ran the “European Star in North America” play before Miami made it cool, anchoring their decade of dominance around André-Pierre Gignac. They have depth. They have history. They don’t get starstruck.
The Pivot Point: August 3, 2024
If you want the exact moment the timeline shifted, pin this date on your wall.
NRG Stadium. Houston, Texas. Leagues Cup Group Stage.
This was supposed to be a coronation. A celebration of Miami’s ascendancy. Instead, it turned into a street fight. And this match matters more than any other for one reason:
It exposed the roster construction flaw.
Here is the breakdown of that pivotal night:
- Early Optimism: Inter Miami, even without an injured Messi, looked competent. Leonardo Campana scored from the spot. Things felt controlled.
- The Response: Tigres didn’t panic. They didn’t fold. Juan Brunetta equalized with a volley that screamed technical superiority.
- The Dagger: Late in the game, Juan Pablo Vigón capitalized on a defensive error. Tigres won 2-1.
Why stick on this one game?
Because Miami had the stars (mostly), but Tigres had the team. The timeline here shows a divergence. Tigres could sub on players who would start for almost any MLS team. Miami, once you stripped away the headlines, was thin.
That loss forced a recalibration in Fort Lauderdale. It proved that “top-heavy” doesn’t work against teams that know how to suffer and grind out a result.
Why This Timeline Scares MLS Executives
This specific rivalry acts as a mirror. And the reflection isn’t always pretty.
When these two teams clash, the narrative of “The Gap is Closing” gets put to the test. We hear it every year. “MLS has caught up to Liga MX.” Has it?
Look at the evidence.
- Physicality: In the timeline of their meetups, Tigres consistently wins the physical battles in midfield.
- Game Management: When Tigres goes up a goal, they kill the game. They suffocate it. MLS teams, Miami included, often turn chaotic when chasing a lead.
It’s awkward. The league wants to sell the Messi Era as absolute dominance. But when you look at the timeline against the top dogs of Mexico—Monterrey, Tigres, Club América—the results are mixed at best.
The “Gignac vs. Messi” Shadow
You can’t talk about this without mentioning the ghosts in the room.
Even when they don’t share the pitch, the timeline is defined by these two figures.
- Gignac: The King of the North. He showed that a superstar can integrate, stay for a decade, and build a dynasty.
- Messi: The Goat. He showed that a superstar can instantly monetize a league and draw global eyeballs.
But in the timeline of actual matches, Gignac’s team often looks more cohesive. The timeline proves that cohesion beats star power about 60% of the time. That is a hard pill for MLS marketing departments to swallow.
Looking Down the Road
We are in 2026 now. The World Cup is on the doorstep.
The Inter Miami vs Tigres timeline serves as the foundational text for this era of North American soccer. It taught MLS executives that signing four guys isn’t enough. You need a bench. You need a defense that doesn’t leak cheap goals in the 84th minute.
Every time these two clubs meet, it feels heavy. It feels like a referendum on the entire MLS project.
Did the Miami experiment work? The trophies say yes. But the head-to-head timeline against Tigres suggests there is still a mountain to climb. The gap hasn’t disappeared; it just got a lot more expensive.
So, watch the next matchup. Ignore the pyrotechnics. Ignore the halftime show. Watch the midfield. That is where the war is won, and that is where Tigres has historically drawn the line in the sand.
Frequently Asked Questions
When did Inter Miami play Tigres UANL in the Leagues Cup?
Inter Miami faced Tigres UANL on August 3, 2024, during the Leagues Cup group stage at NRG Stadium in Houston, resulting in a 2-1 victory for Tigres.
Did Lionel Messi play against Tigres in 2024?
No. Lionel Messi missed the August 2024 match against Tigres due to an ankle injury sustained during the Copa América final earlier that summer.
Who scored the goals in the 2024 Inter Miami vs Tigres match?
Leonardo Campana scored for Inter Miami (penalty), while Juan Brunetta and Juan Pablo Vigón scored the goals for Tigres UANL.
Why is the Inter Miami vs Tigres rivalry considered important?
It represents a benchmark clash between the highest-profile MLS ‘super team’ and one of the most consistent, dominant Liga MX sides, acting as a litmus test for the quality gap between the two leagues.

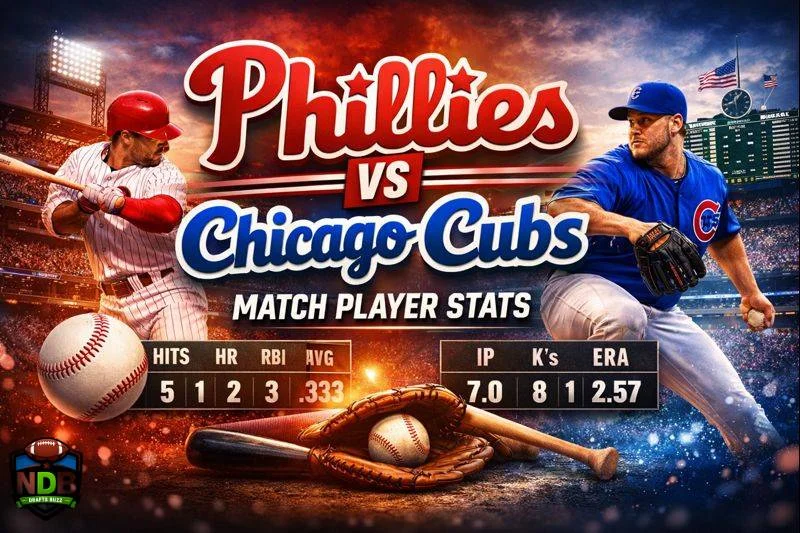
As the sun sets over the ballpark, anticipation fills the air for one of baseball’s most exciting matchups: the Phillies vs chicago cubs match player stats. These two teams have a storied history and passionate fan bases that add to the electric atmosphere of each game. With both teams vying for dominance in their respective divisions, every pitch and swing can make or break their season.
In this showdown, player contributions will be put under a microscope as we dive into key statistics that highlight individual performances. From clutch hits to critical strikeouts, understanding these player stats is essential for grasping how each athlete impacts their team’s success on the field. As we explore what makes both squads tick, let’s take a closer look at who stands out and what those numbers really tell us about this thrilling contest between two Major League Baseball heavyweights.
What is Phillies vs chicago cubs match player stats?
Phillies vs chicago cubs match player stats are crucial in understanding the dynamics of any baseball matchup, especially between teams like the Phillies and Cubs. These statistics provide insights into how individual players contribute to their team’s overall performance.
When looking at player stats for this particular matchup, fans can analyze batting averages, home runs, RBIs, and on-base percentages. Each figure paints a picture of how effective hitters will be against opposing pitchers.
Pitching stats also play a vital role. Metrics such as ERA (earned run average), WHIP (walks plus hits per inning pitched), and strikeout rates help gauge the effectiveness of starting rotations and bullpen arms during the game.
Fielding statistics should not be overlooked either. Errors committed or defensive plays made can significantly impact outcomes in close games. Understanding these numbers helps paint a complete picture of what to expect when these two teams face off.
Key players to watch for each team
For the Phillies vs chicago cubs match player stats, Bryce Harper stands out as a key player. His power at the plate can change the momentum of any game. Fans eagerly watch him for his ability to deliver in clutch situations.
On the mound, Aaron Nola is vital for Philadelphia’s success. Known for his precision and strikeout capability, he often sets the tone early in games, giving his team confidence.
Switching gears to Chicago, look out for Nico Hoerner. He’s been making waves with his consistent batting and sharp base running. His agility on defense adds another layer of strength to the Cubs lineup.
Meanwhile, Marcus Stroman brings energy to Chicago’s pitching staff. With an impressive repertoire, he thrives under pressure and has a knack for getting critical outs when needed most. Each player’s contribution could be pivotal in this matchup.
Batting statistics comparison
When examining the batting statistics of the Phillies and Cubs, intriguing differences emerge. Both teams showcase formidable lineups that can change a game in an instant.
The Phillies boast power hitters who excel in home runs and RBIs. Players like Bryce Harper consistently rank among league leaders, adding depth to their offensive strategy.
On the other hand, the Chicago Cubs emphasize contact hitting and on-base percentage. With players such as Nico Hoerner leading the charge, they focus on getting runners on base to create scoring opportunities.
Strikeout rates also play a significant role in this matchup. The Cubs have worked to minimize strikeouts while maintaining aggressive swings at pitches within their zone.
Comparing these aspects reveals how each team’s approach influences not just individual performance but overall game dynamics too. Each inning carries potential surprises as these stats come into play during critical moments of the match.
Pitching statistics comparison
When examining the pitching statistics for the Phillies and Cubs, specific numbers stand out. The strikeout rates tell a compelling story of each team’s power on the mound.
The Phillies boast a solid average with their ace consistently racking up Ks per nine innings. This ability to miss bats has been crucial in high-pressure situations.
On the other hand, the Cubs have focused on control over sheer velocity. Their starters often achieve lower walk rates, showcasing an impressive command that minimizes free passes.
While both teams have strengths in different areas, how they manage their bullpens can be pivotal during tight games. Recent performances indicate which team may hold an edge when it matters most late in matches. Evaluating these stats offers insight into potential matchups and strategies that could unfold throughout this rivalry clash.
Fielding statistics comparison
Fielding statistics often tell a different story than batting or pitching. In the matchup between the Phillies and Cubs, fielding prowess could play a crucial role in determining outcomes.
The Phillies boast solid defensive metrics this season. Their infield has shown reliable hands, while outfielders have made impressive catches that save runs.
On the other side, the Cubs are known for their agility. Quick reflexes and smart positioning have defined their defense, particularly with veteran players who read plays well.
Errors can change games quickly. A single misstep might allow an inning to extend or lead to unexpected runs scored by opponents.
Both teams will rely on their defenses not only to support pitchers but also to maintain momentum throughout the game. The pressure is on each player as they stake their claims across every base and position on the field.
Impact of player contributions on team success
Player contributions play a pivotal role in determining the success of any team, especially in high-stakes matchups like the Phillies vs chicago cubs match player stats.
When individual players shine, it elevates the entire team’s performance. A strong batting display can shift momentum quickly. Sluggers driving runs home create opportunities that fuel morale and confidence.
Pitching is equally crucial. An ace on the mound can stifle opposing hitters and dictate the pace of the game. When pitchers perform well, they not only limit runs but also give batters more chances to capitalize offensively.
Fielding cannot be overlooked either. Defensive plays often save critical runs and shift energy back to an offense looking to respond or extend leads. In this matchup, every player’s contribution matters immensely as teams strive for victory in their quest for postseason glory.
Final thoughts and predictions for the match outcome
As the Phillies gear up to face off against the Phillies vs chicago cubs match player stats, all eyes will be on key players who could tip the scales. Each team boasts impressive stats that hint at potential turning points during the match.
The Phillies have shown resilience this season. With their offensive power, they can exploit any pitching weakness from the Cubs. Meanwhile, Chicago’s solid bullpen might counteract Philly’s bats effectively.
Weather conditions and ballpark factors may also play a role in how each player performs under pressure. The dynamics between starting pitchers will set the tone early on.
Fans should prepare for an intense battle where every pitch counts and player contributions could determine victory or defeat. Expect strategic plays designed to capitalize on any missteps by opponents as both teams strive for triumph in this pivotal matchup.
Conclusion
The Phillies vs chicago cubs match player stats not only promises thrilling baseball but also highlights the individual talents that contribute to each team’s success. Analyzing player stats reveals how crucial every hit, pitch, and defensive play can be in determining the outcome of a game.
Both teams have standout players whose performances could swing momentum either way. The batting statistics provide insight into offensive strengths while pitching stats highlight which team might dominate on the mound. Fielding capabilities further accentuate how errors or stellar plays can change a game’s trajectory.
As fans look forward to this exciting matchup, understanding these player contributions enhances appreciation for the sport. With both teams boasting impressive rosters, predicting an outright winner remains challenging yet intriguing. As we await game day, it’s evident that every player’s contribution will matter significantly in this fierce rivalry between two beloved franchises.
The football pitch has long been a stage for epic battles, and few rivalries capture the essence of Italian football like that between Ac milan vs ssc bari timeline. While one club boasts a storied history filled with triumphs on both domestic and international fronts, the other represents the underdog spirit that often characterizes the beautiful game. This clash is not just about three points; it’s about pride, passion, and an age-old competition etched in time.
From their first encounters back in the 1930s to recent showdowns in front of roaring crowds, every match tells a story of skill, determination, and unforgettable moments. Fans from both sides eagerly await each meeting, knowing it could serve up drama worthy of legends. Join us as we delve into the ac milan vs ssc bari timeline a journey through history filled with thrilling matches and memorable players who have graced these two clubs.
What is Ac milan vs ssc bari timeline?
The AC Milan vs SSC Bari timeline is a fascinating journey through Italian football history. It captures the intense encounters between two clubs with distinct legacies.
This rivalry began in the early 20th century and has evolved over decades, reflecting changes in both teams’ fortunes. From initial matchups to crucial league games, each encounter tells a unique story.
Fans of both clubs cherish these moments, filled with unforgettable goals and stunning plays. The matches are more than just points; they symbolize pride for their respective cities.
As time progressed, the stakes grew higher. Each game brought its own drama—last-minute winners or contentious refereeing decisions that left fans buzzing long after the final whistle.
Tracing this timeline reveals not only statistics but also emotions intertwined with every match played on hallowed turf. The legacy continues as new chapters unfold in this enduring rivalry.
Early Encounters: 1930s-1960s
The early encounters between Ac milan vs ssc bari timeline date back to the 1930s, a time when Italian football was evolving rapidly. The two clubs first faced off in Serie A during the 1931-32 season.
Milan dominated these initial matchups, showcasing their strength and skill on the pitch. They often outplayed Bari with tactical finesse and star players who would become legends.
As World War II approached, many leagues faced interruptions, but this rivalry persisted through various challenges. The post-war era saw renewed competition as both teams aimed for glory.
By the late 1950s, matches became more competitive. Bari started to hold their ground against Milan’s formidable lineup. This shift began laying the groundwork for future clashes that fans still talk about today. Each game from this period contributed layers of history to an already rich tapestry of Italian football culture.
The Golden Era: 1980s-1990s
The 1980s and 1990s marked a transformative period for both Ac milan vs ssc bari timeline. This era witnessed the rise of tactical football, with teams adopting innovative strategies that captivated audiences.
AC Milan emerged as a powerhouse during this time, showcasing exceptional talent on the field. Legendary players like Marco van Basten and Franco Baresi became synonymous with success. Their skills redefined what it meant to compete at the highest level.
Bari, though not as dominant, had its moments of brilliance. Memorable matches against AC Milan showcased their resilience and fighting spirit. The underdog status often led to thrilling encounters that left fans breathless.
Stadiums were electric during these clashes. Each game was more than just three points; it was about pride, tradition, and legacy in Italian football history. The rivalry reached new heights as supporters passionately cheered for their teams amidst fierce competition.
Modern Day Matches: 2000s-present
The rivalry between Ac milan vs ssc bari timeline took on a new dimension in the 2000s. While matches were less frequent, every encounter carried the weight of history.
In recent years, the games have showcased thrilling moments. The intensity remains high, with both teams bringing their best to the pitch. Fans eagerly anticipate these clashes as they evoke nostalgia for past battles.
Key players from both sides have left a mark during this period. Emerging stars and seasoned veterans alike have contributed to memorable performances that keep supporters on edge.
Each match tells its own story, filled with unexpected turns and fierce competition. Whether it’s through dramatic goals or tense finishes, these encounters continue to capture attention in Italian football circles. As time marches on, each meeting adds another chapter to an already rich narrative between these two clubs.
Memorable Moments and Players in the Rivalry
The Ac milan vs ssc bari timeline rivalry has delivered unforgettable moments that fans cherish. One such instance was the dramatic 3-2 victory for Milan in a late-season clash during the 1980s. The tension in the stadium was palpable as both teams fought tooth and nail.
Players like Marco van Basten and Franco Baresi made their mark, showcasing extraordinary skills that left spectators in awe. Their contributions elevated this matchup beyond mere competition, turning it into a theatrical display of football artistry.
On Bari’s side, legends like Giuseppe Signori brought flair to the pitch. His striking abilities often challenged even the strongest defenses, making every encounter worthwhile.
These matches are more than just statistics; they create stories woven into the fabric of Italian football history. Each goal scored or save made adds another layer to an already rich narrative between these two clubs.
The Impact of the Rivalry on Italian Football
The rivalry between Ac milan vs ssc bari timeline transcends mere statistics. It embodies the spirit of Italian football, igniting passion among fans across the country.
This fierce competition has often influenced league dynamics. Teams battle not just for points but for pride and cultural identity. Matches spark intense emotions, drawing in supporters from various regions.
Players who have taken part in this rivalry leave a lasting legacy. Their performances are etched into history, inspiring future generations to take up football.
Moreover, this clash showcases tactical evolution in the sport. Coaches adapt their strategies based on past encounters, contributing to Italy’s rich footballing narrative.
Broadcasted globally, these matches elevate the profile of Serie A as well. International audiences tune in to witness this historic showdown, enhancing Italy’s reputation on the world stage.
Through victories and defeats alike, both clubs continue to shape each other and reinforce their roles within Italian football culture.
A Timeless Battle on the Pitch
The encounters between Ac milan vs ssc bari timeline have created a tapestry of memories etched in Italian football history. Each match showcases the essence of competition, skill, and passion.
These clashes illustrate more than just statistics; they highlight the relentless spirit of both teams. Every goal scored reverberates through the fans, igniting their loyalty and pride.
Players from different eras have left their mark on this rivalry. Legends emerge with every encounter, showcasing remarkable talent on that hallowed pitch.
With each new season comes fresh anticipation for another chapter in this ongoing saga. The thrill lies not just in winning but also in the journey shared by players and supporters alike.
As we reflect on these historic battles, it’s clear that AC Milan vs SSC Bari is more than a mere fixture; it’s an enduring narrative woven into the fabric of football culture.
Conclusion
The rivalry between Ac milan vs ssc bari timeline is more than just a series of matches; it’s a tapestry woven with passion, history, and unforgettable moments. From the early days in the 1930s to modern-day clashes, each encounter tells its own story. The evolution of this rivalry showcases not only changes in team dynamics but also shifts in Italian football as a whole.
Memorable players have graced the pitch during these encounters, leaving their mark on fans and the sport itself. The fierce competition has contributed significantly to both clubs’ identities over the decades. Each match fuels excitement among supporters and adds layers to an already rich narrative.
This historic battle continues to captivate football enthusiasts around the world. As both teams look toward future contests, one thing remains certain: every time they meet on the pitch, it will be another chapter added to their ongoing saga a timeless clash that embodies the spirit of Italian football at its finest.
Sports
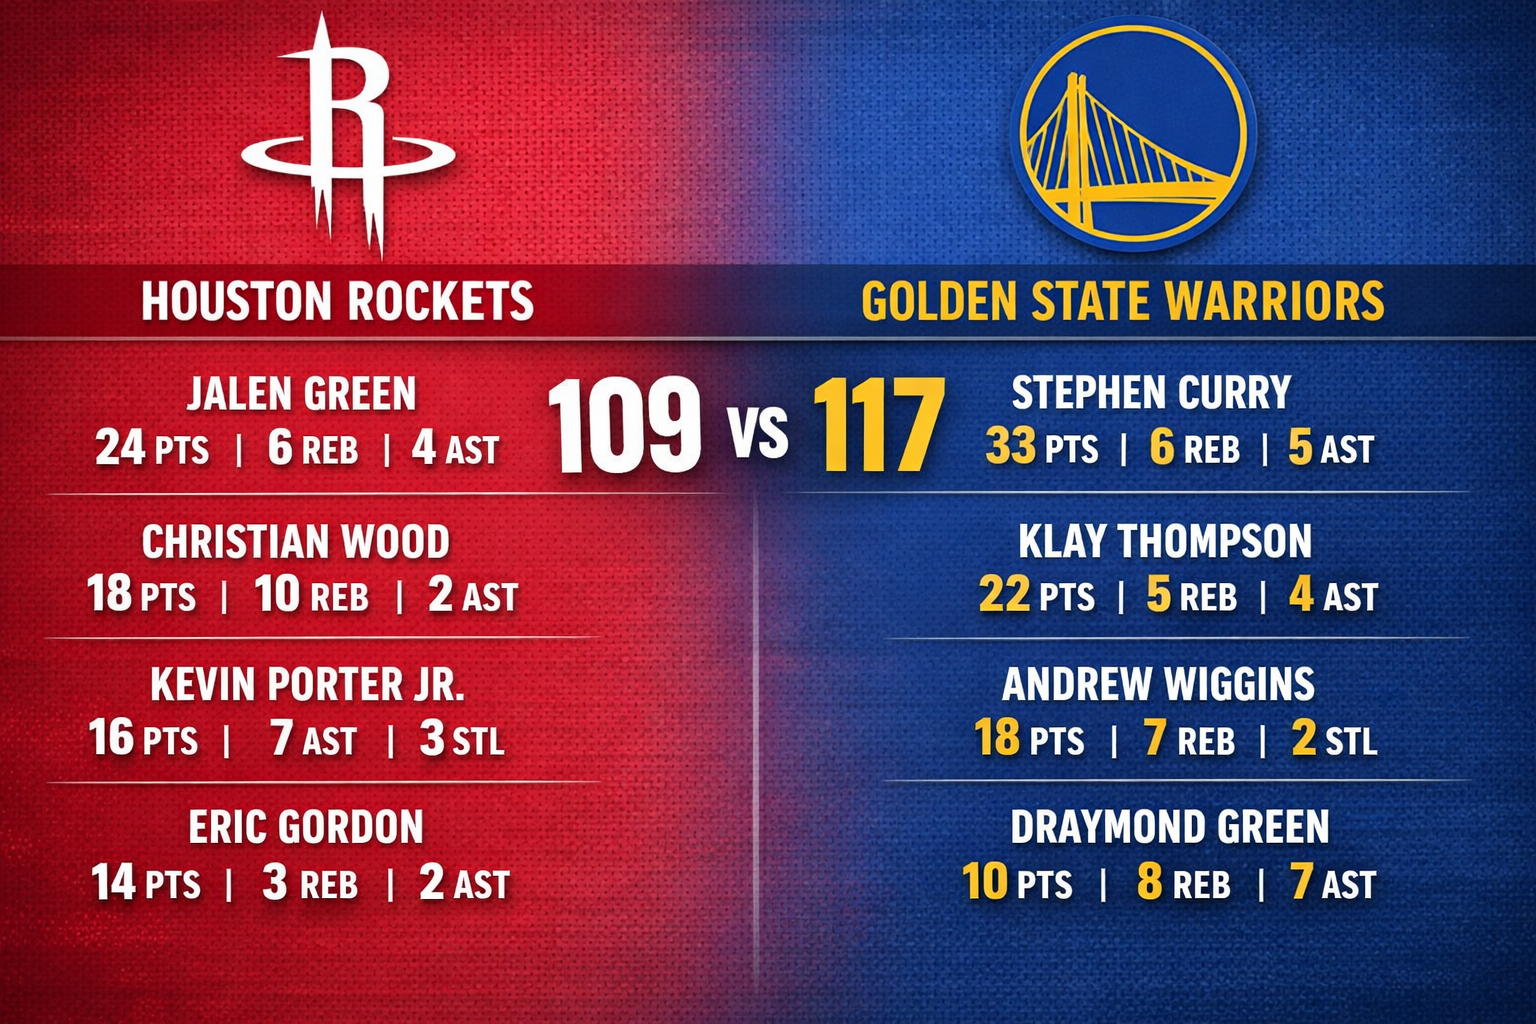
The Dynasty on Life Support? What the Houston Rockets vs Golden State Warriors Match Player Stats Actually Reveal
You can feel it, can’t you? The shift. It’s not subtle anymore.
For years, the Golden State Warriors were the inevitable setting sun that burned your eyes. You couldn’t look away. They were precision. They were inevitability. But watching them scramble against the Houston Rockets recently feels different. It feels like watching a heavyweight champ in the 12th round, knees wobbling, hoping the bell rings before the knockout.
The box scores tell the story. And it’s not a pretty one for the faithful in the Bay.
We aren’t just looking at who won or lost. We’re tearing apart the player stats to find the pulse of two franchises moving in opposite directions. One rocketing up (pun intended). One slowly, painfully, coming down to earth.
The Sengun Factor: A Nightmare in the Paint
Let’s rip the band-aid off. The Warriors have a size problem. And his name is Alperen Sengun.
In the most recent clashes, Sengun hasn’t just played; he’s bullied. Look at the line from the gritty 91-90 Houston win: 26 points, 11 rebounds, 5 assists.
Why does this matter? Because Draymond Green, for all his defensive genius, isn’t getting younger. And Kevon Looney can only do so much. Sengun is feasting on the interior, shooting efficient percentages (over 55% in the paint) and creating second-chance points that break the Warriors’ back.
When Golden State was at its peak, they erased big men. They ran them off the floor. Now? They’re getting buried by them. Sengun’s ability to act as a hub—matching Draymond’s playmaking but adding elite scoring gravity—is the specific kryptonite this version of the Warriors cannot handle.
What is True Shooting Percentage?
True Shooting Percentage (TS%) is a measure of shooting efficiency that takes into account field goals, 3-point field goals, and free throws. It provides a more accurate picture of a player’s scoring impact than raw field goal percentage.
Jalen Green vs. Steph Curry: The Guarding of the Guard
It feels blasphemous to type this. But we have to look at the efficiency gap.
Steph Curry is still a wizard. No doubt. But look at his 8-of-17 shooting night in the recent matchup. solid? Sure. Dominant? No. The Rockets threw bodies at him—Brooks, Thompson—and wore him down.
On the other side, Jalen Green is shaking off the “inefficient chucker” label.
In clutch moments, it was Green hitting the free throws (an area where Golden State imploded, missing 18 freebies in an earlier meetup). Green’s burstiness is getting him to the line. Steph is settling for jumpers. That’s the margin. Youth attacks the rim; age settles for the arc. When the jumpers don’t fall, the Warriors’ offense looks stuck in mud.
Jonathan Kuminga: The Only Lifeline?
If there is hope for Golden State, it wears number 00.
While the “Splash Brothers” era fades, Jonathan Kuminga is the only one playing with the athletic arrogance needed to beat Houston. His 33-point explosion in the December matchup wasn’t just a career high. It was a statement.
He shot over 50% from the field. He attacked the rim. He looked like the only Warrior capable of matching Houston’s verticality.
But here’s the rub. The Warriors won that game because Kuminga played like a superstar. Can they bank on that every night? Probably not. When the dynasty relies on Kuminga to bail out Steph and Draymond, the hierarchy is broken.
The Turnover & Free Throw Disparity
This is where games are lost.
- Free Throws: You can’t give away points. In the overtime loss (127-121), the Warriors bricked 18 free throws. Eighteen. That is a death sentence against a young, hungry team like Houston that thrives in transition.
- Turnovers: The Rockets’ youth shows up in their frantic energy, but the Warriors’ age shows up in lazy passing. The assist-to-turnover ratio for Golden State in these matchups has dipped below their championship standard of 2.5:1.
Is the Window Closed?
Maybe “Life Support” is dramatic. But the stats from these Rockets vs. Warriors matchups scream transition.
The Rockets are winning the hustle stats—offensive rebounds, loose balls, transition points. The Warriors are relying on half-court execution that just isn’t as sharp as it was in 2022.
Houston used to be the team you played to get right. Now, they’re the team that exposes your age. If these player stats tell us anything, it’s that the torch isn’t just being passed. It’s being snatched.
Frequently Asked Questions
Who was the top scorer in the most recent Rockets vs Warriors game?
In the December 11 clash, Alperen Sengun led the Rockets with 26 points, while Jonathan Kuminga has been the recent scoring leader for the Warriors, dropping a career-high 33 points in the prior matchup.
What are the key stats defining the Rockets’ recent success against Golden State?
The Rockets have dominated the paint and free-throw line. Alperen Sengun’s rebounding (11+ boards) and the Warriors’ poor free-throw shooting (missing 18 in one game) have been the deciding factors.
How did Steph Curry perform in the last match against Houston?
Curry had a relatively quiet night by his standards, scoring 19 points on 8-of-17 shooting. The Rockets’ length and physical defense limited his explosive outbursts.
Did Jalen Green play well against the Warriors?
Yes. Jalen Green scored 26 points in the 91-90 victory, including critical free throws in the final seconds to seal the win, showing improved efficiency and clutch decision-making.
Trending: Inter Miami vs Tigres UANL Timeline
-

 Law5 months ago
Cnlawblog: Your Go To Resource for Legal Updates
-

 Technology6 months ago
Hypackle: Revolutionizing Team Communication in the Digital Age
-

 Blog6 months ago
NHentai.nef: The Ultimate Resource for Doujinshi Enthusiasts
-

 Digital Marketing5 months ago
Troozer com: Your Ultimate Guide to Online Shopping
-

 Blog6 months ago
LexatSmallville: Intersection of Friendship and Rivalry in Smallville
-

 Blog6 months ago
Lufanest: How It Influences Culture and Society Today
-

 Lifestyle6 months ago
Itzhak ezratti wife: A Journey of Love and Resilience
-

 Digital Marketing6 months ago
CJMonsoon: Shaping the Online Writing Community